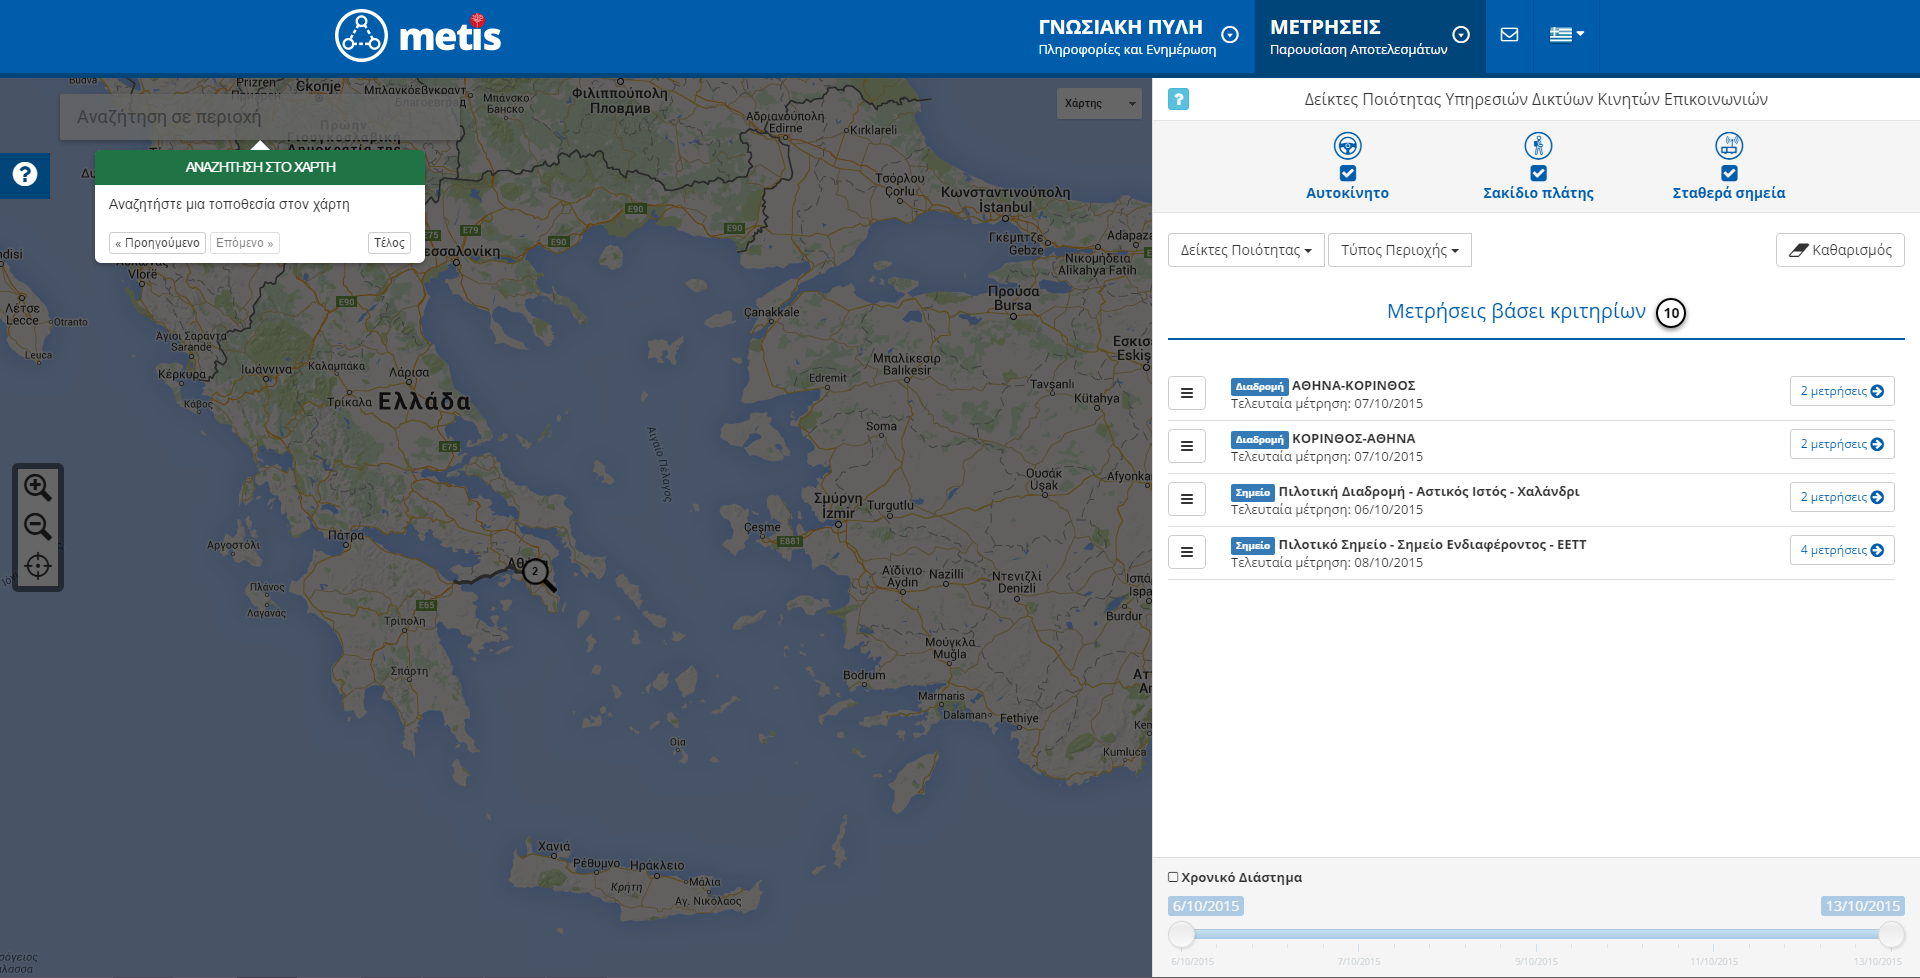
I choose from their available filters "Quality Indicators" those that I want to compare.

Graphs with statistical measurements that were compared are displayed.

I choose from the available filters "Quality Score" and measurement for comparison. I can also choose "Provider" and "Technology".

Graphs with statistical measurements that were compared are displayed.

I choose from the available filters "Quality Index". I can even choose "Provider" and "Technology". If I don't choose any of the available values, all results will be displayed.

I press "Apply" and the points are displayed on the map.

I zoom on the map and the measurement points that are in the visual field map of the graph are displayed.

I can see the statistics in graph.
They appear by clicking "View map" and selecting Provider and Technology.

There are options on the measurement as Print, Save and Download of measurement data.

By clicking on the “Back” button, results are hidden and the measurement search results are displayed.

By clicking on the button , the size of the window may be adjusted.
Λεπτομέρειες χρήσης
Initially, the users sees all available measurements.
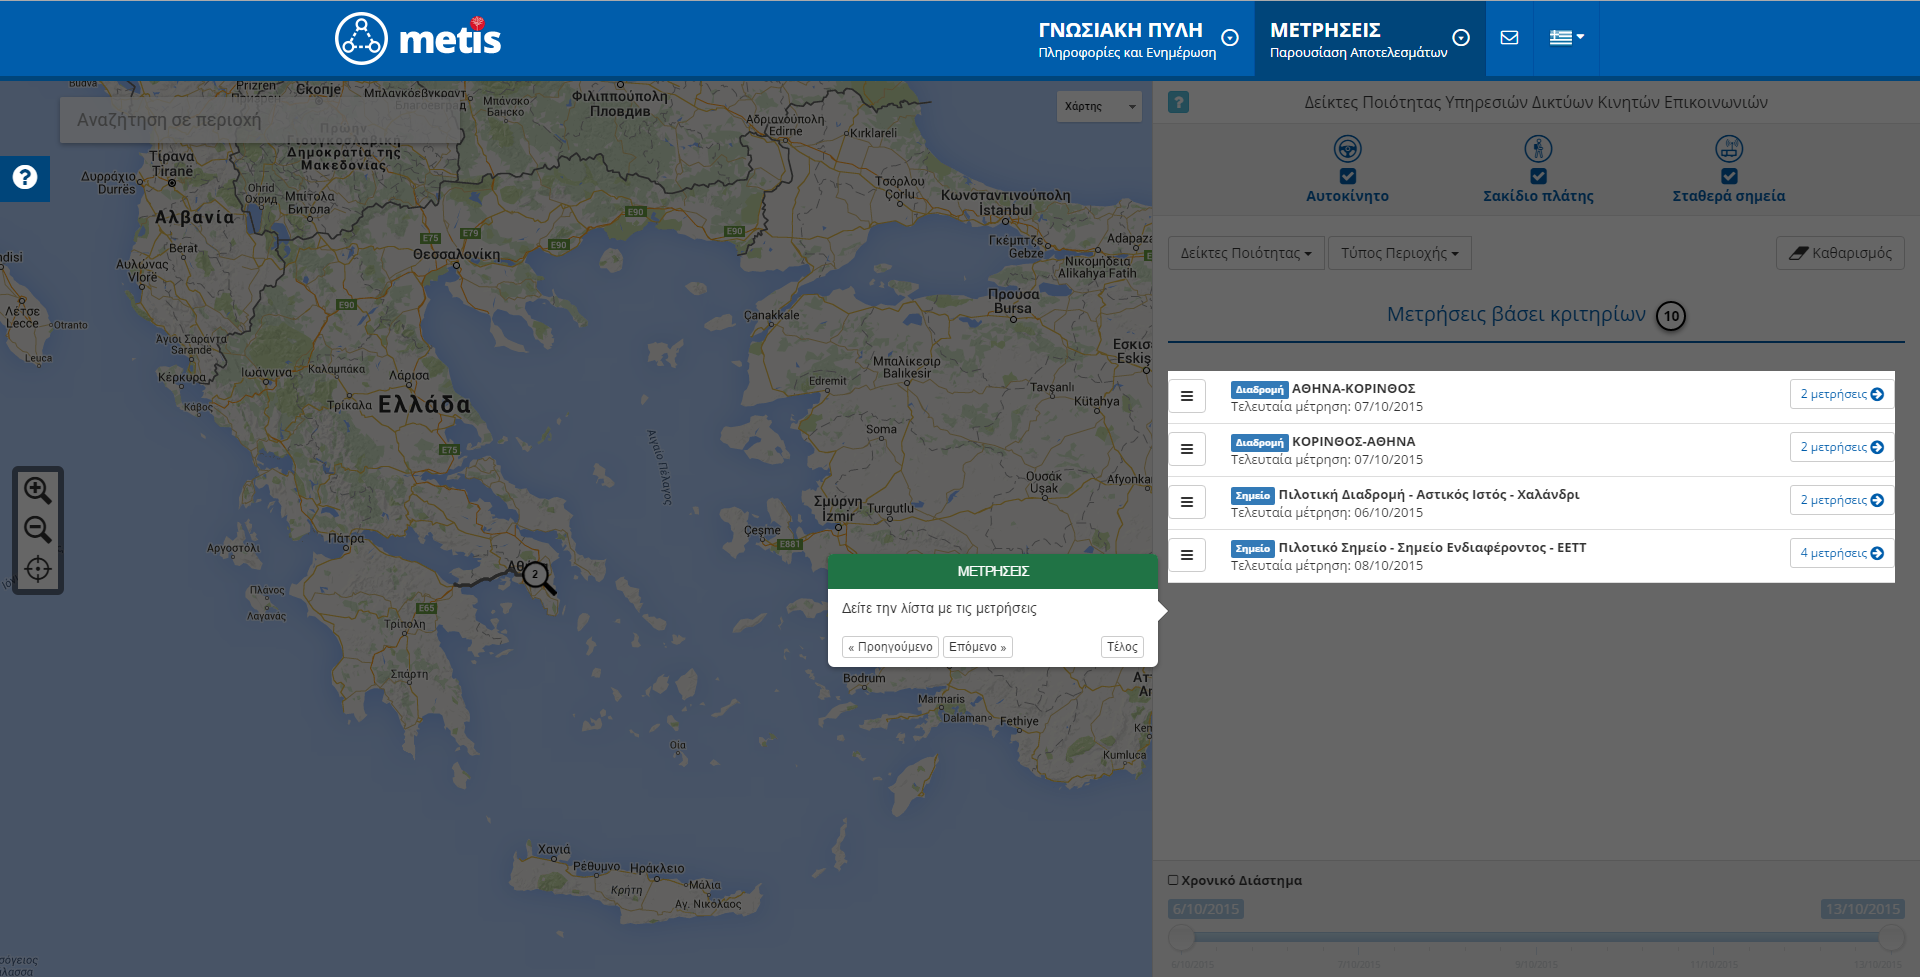
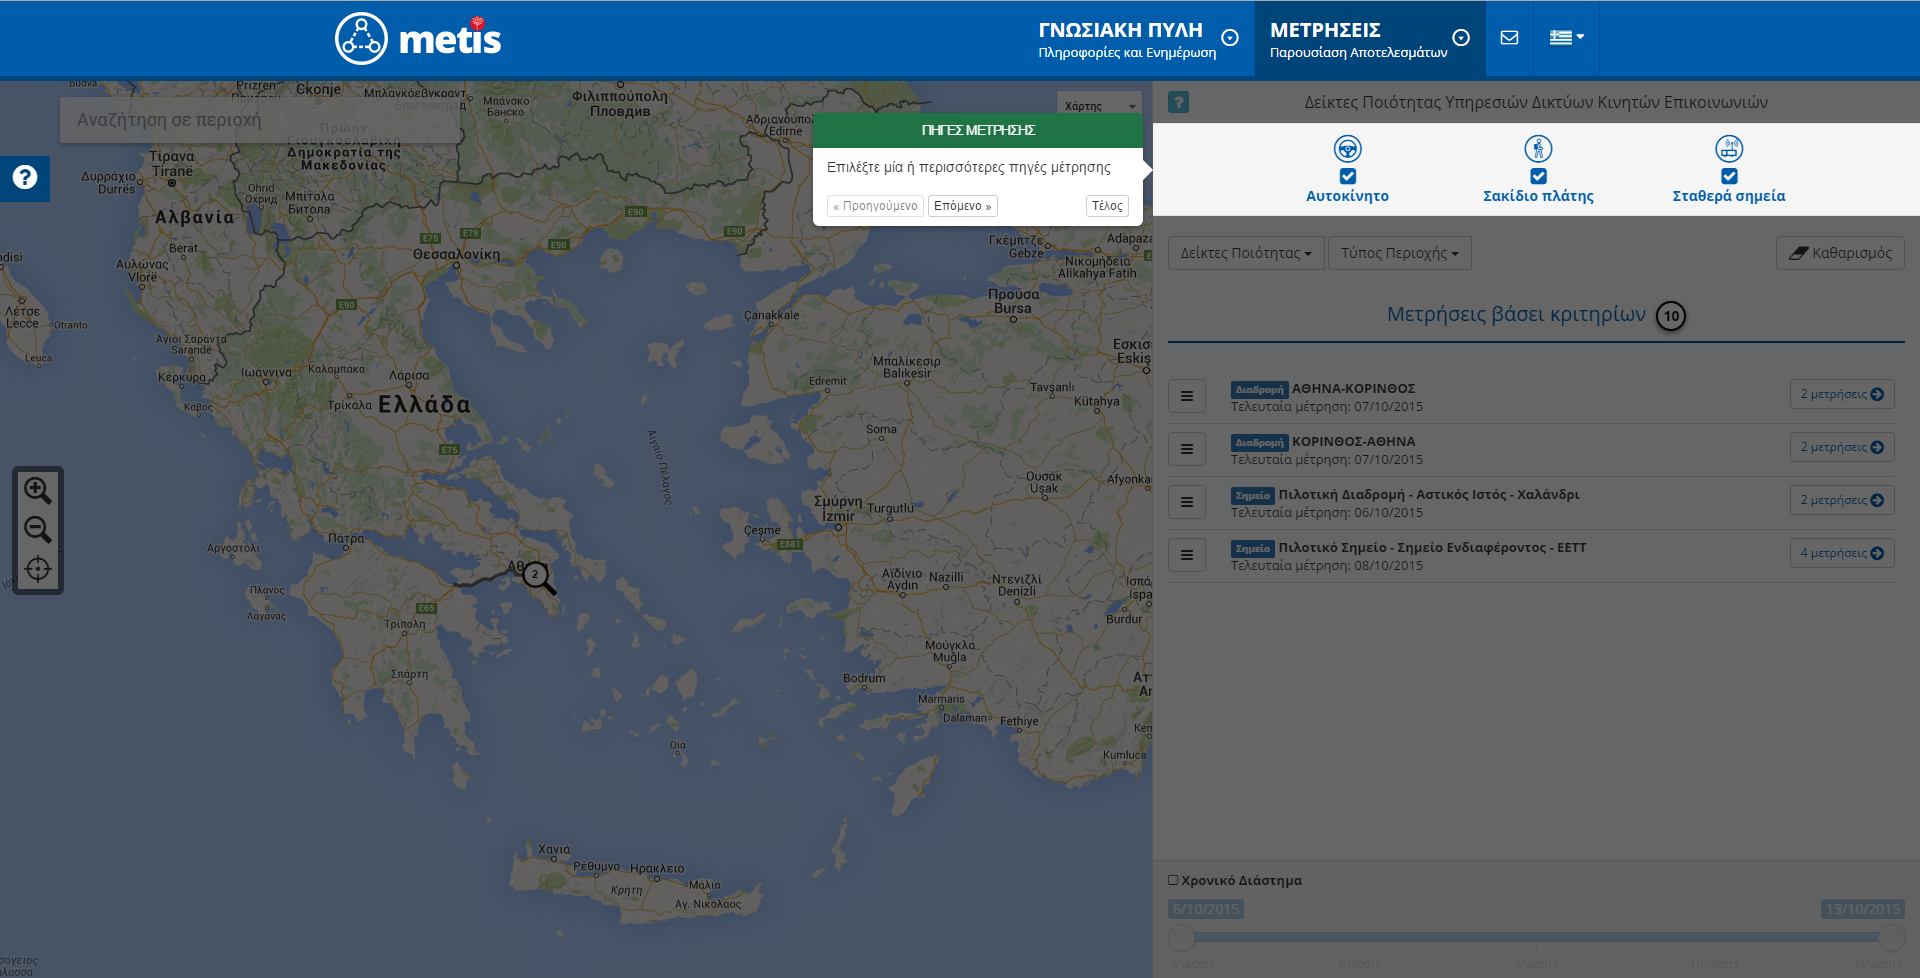
For more specific results, they can choose the measurement source they are interested in.
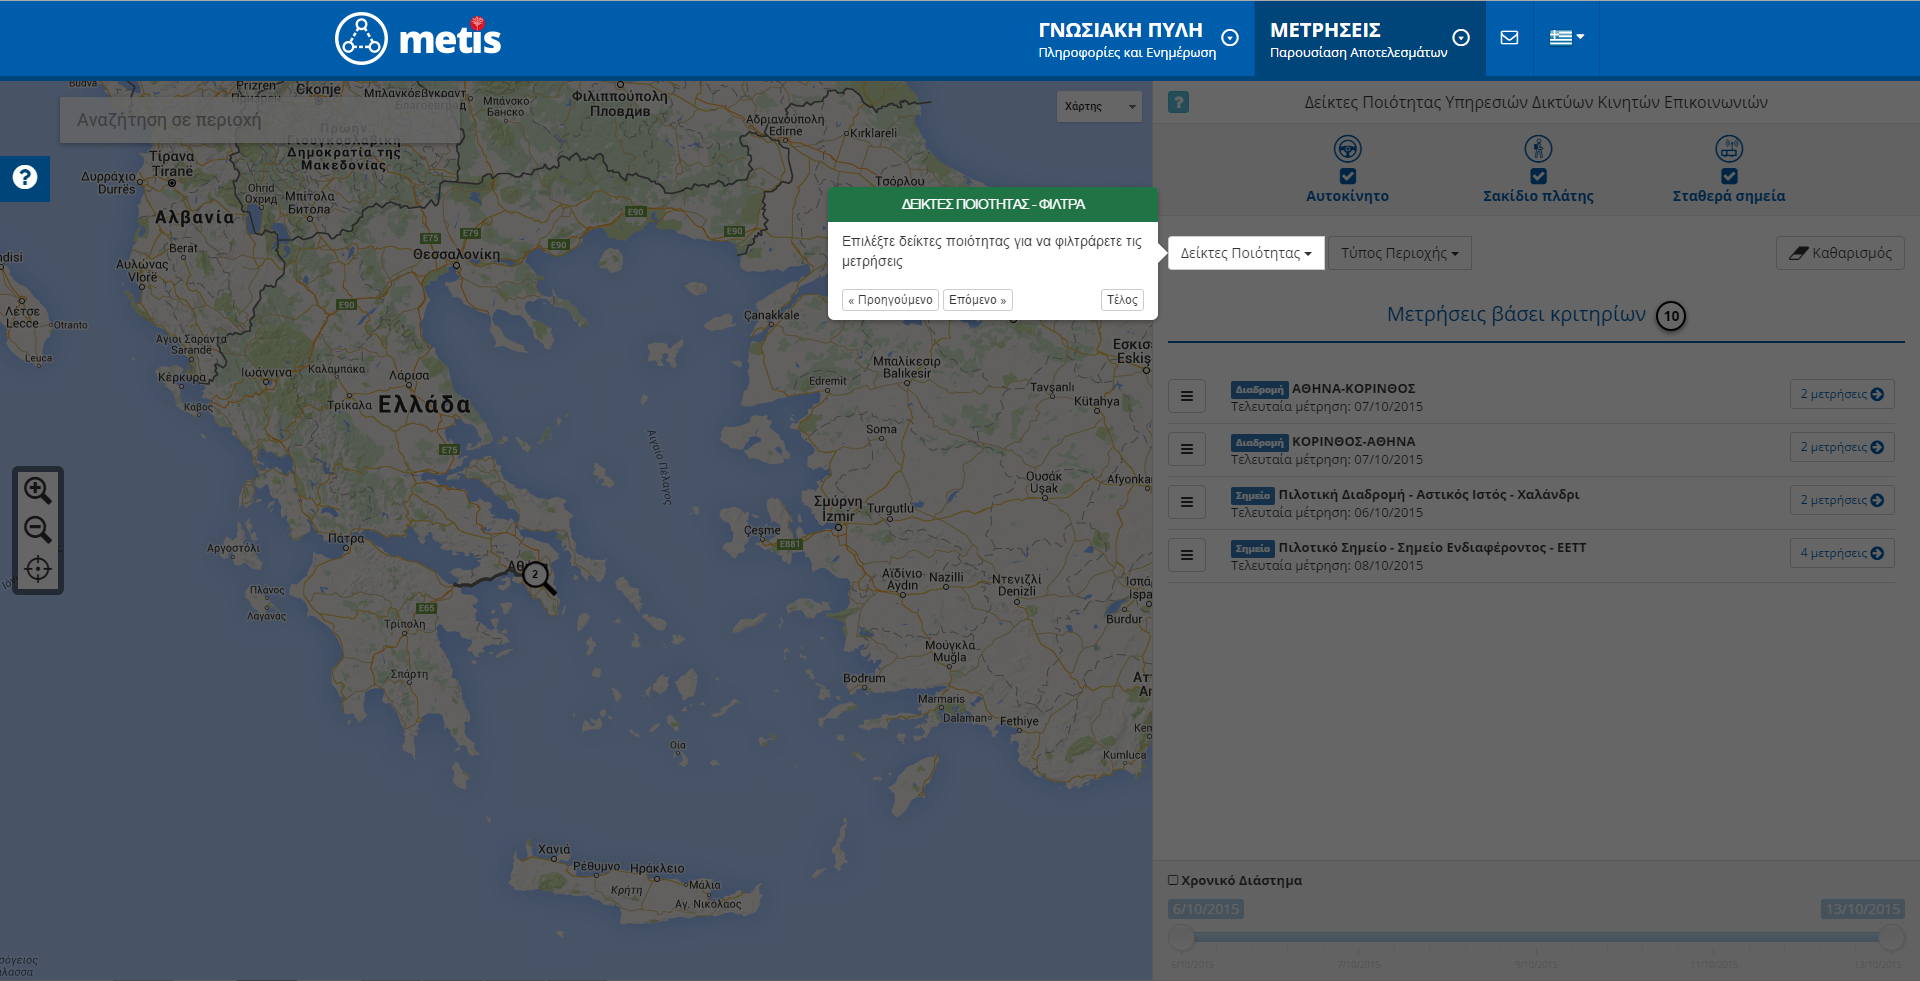
They can choose a specific quality index.
They can choose a certain type of area.
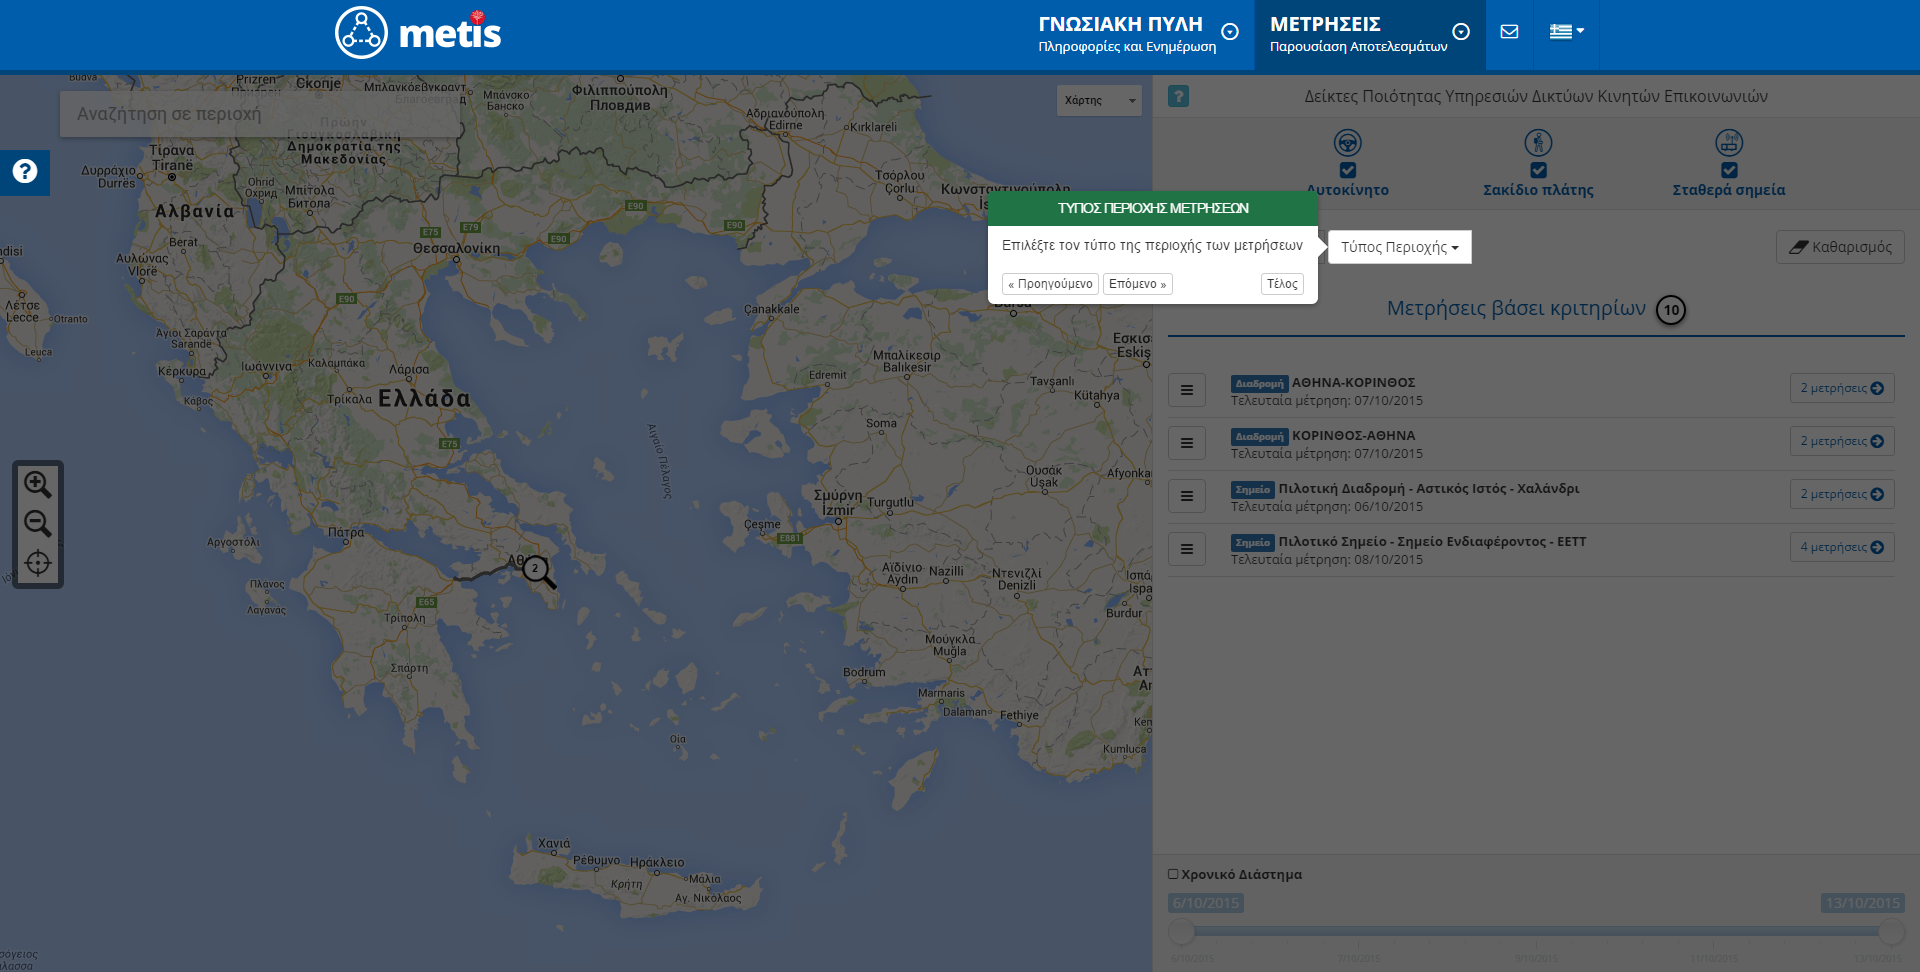
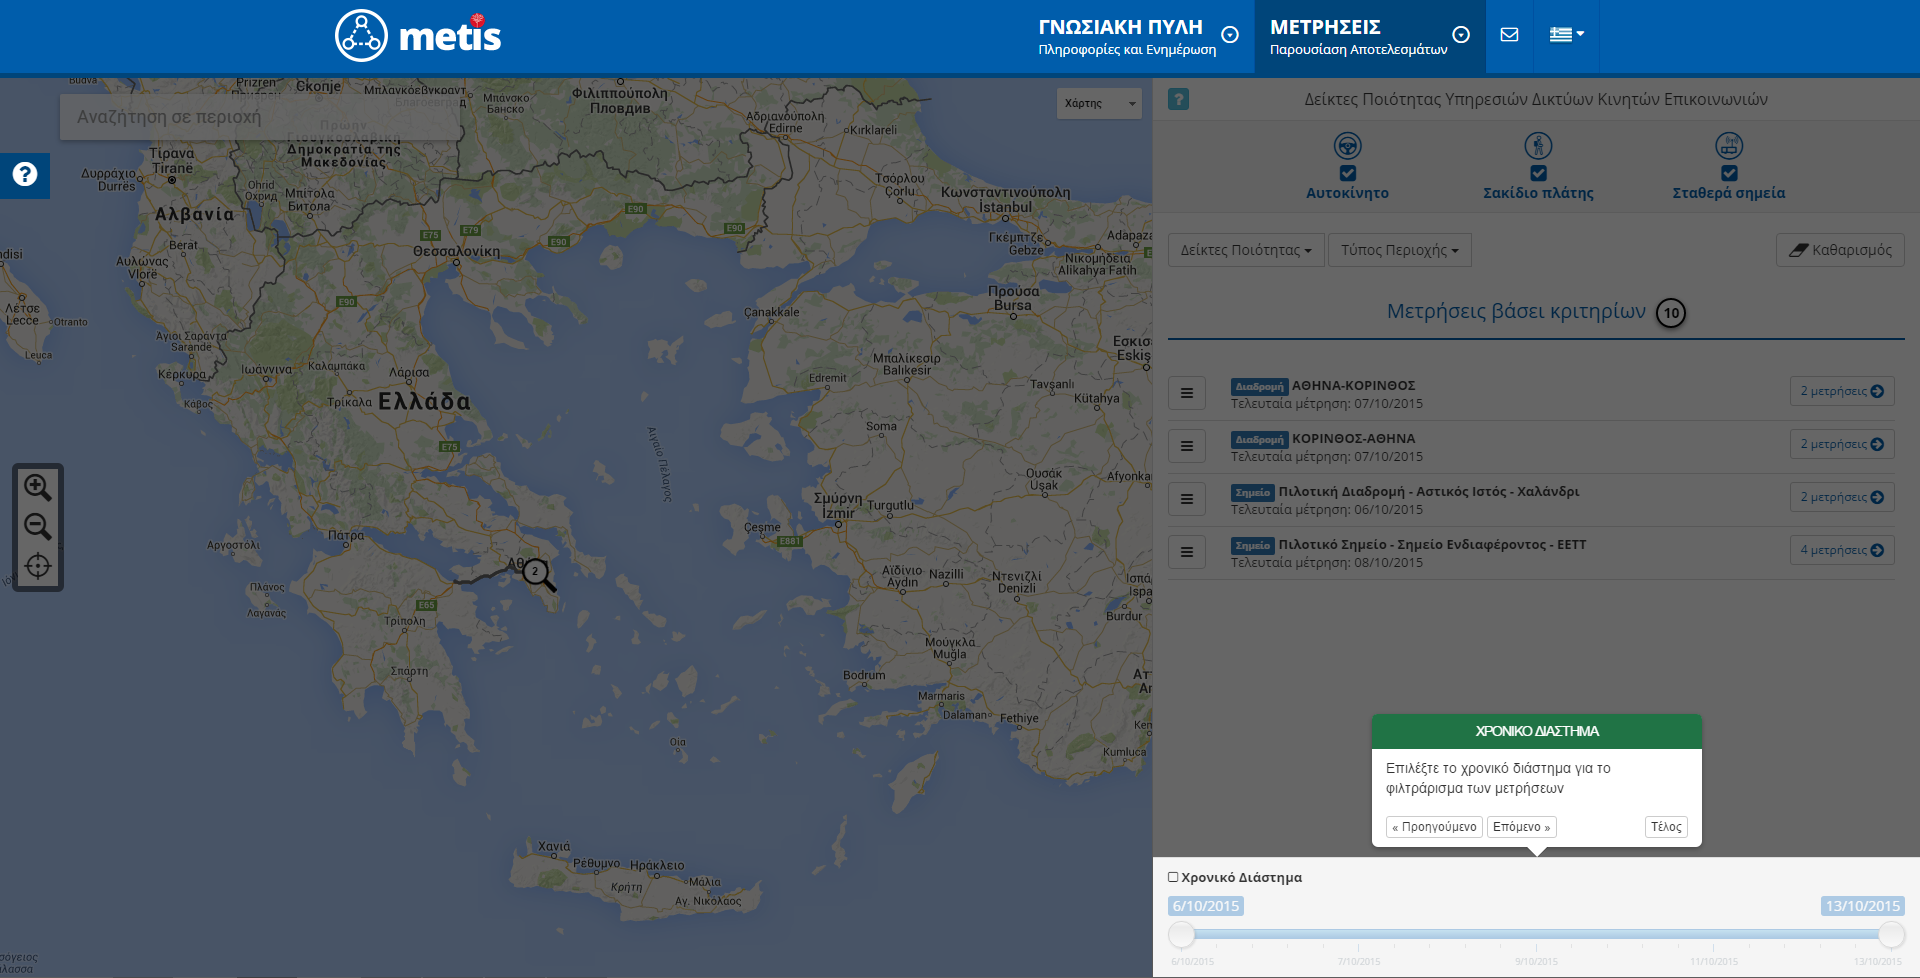
For better filtration, they can choose a specific time space.
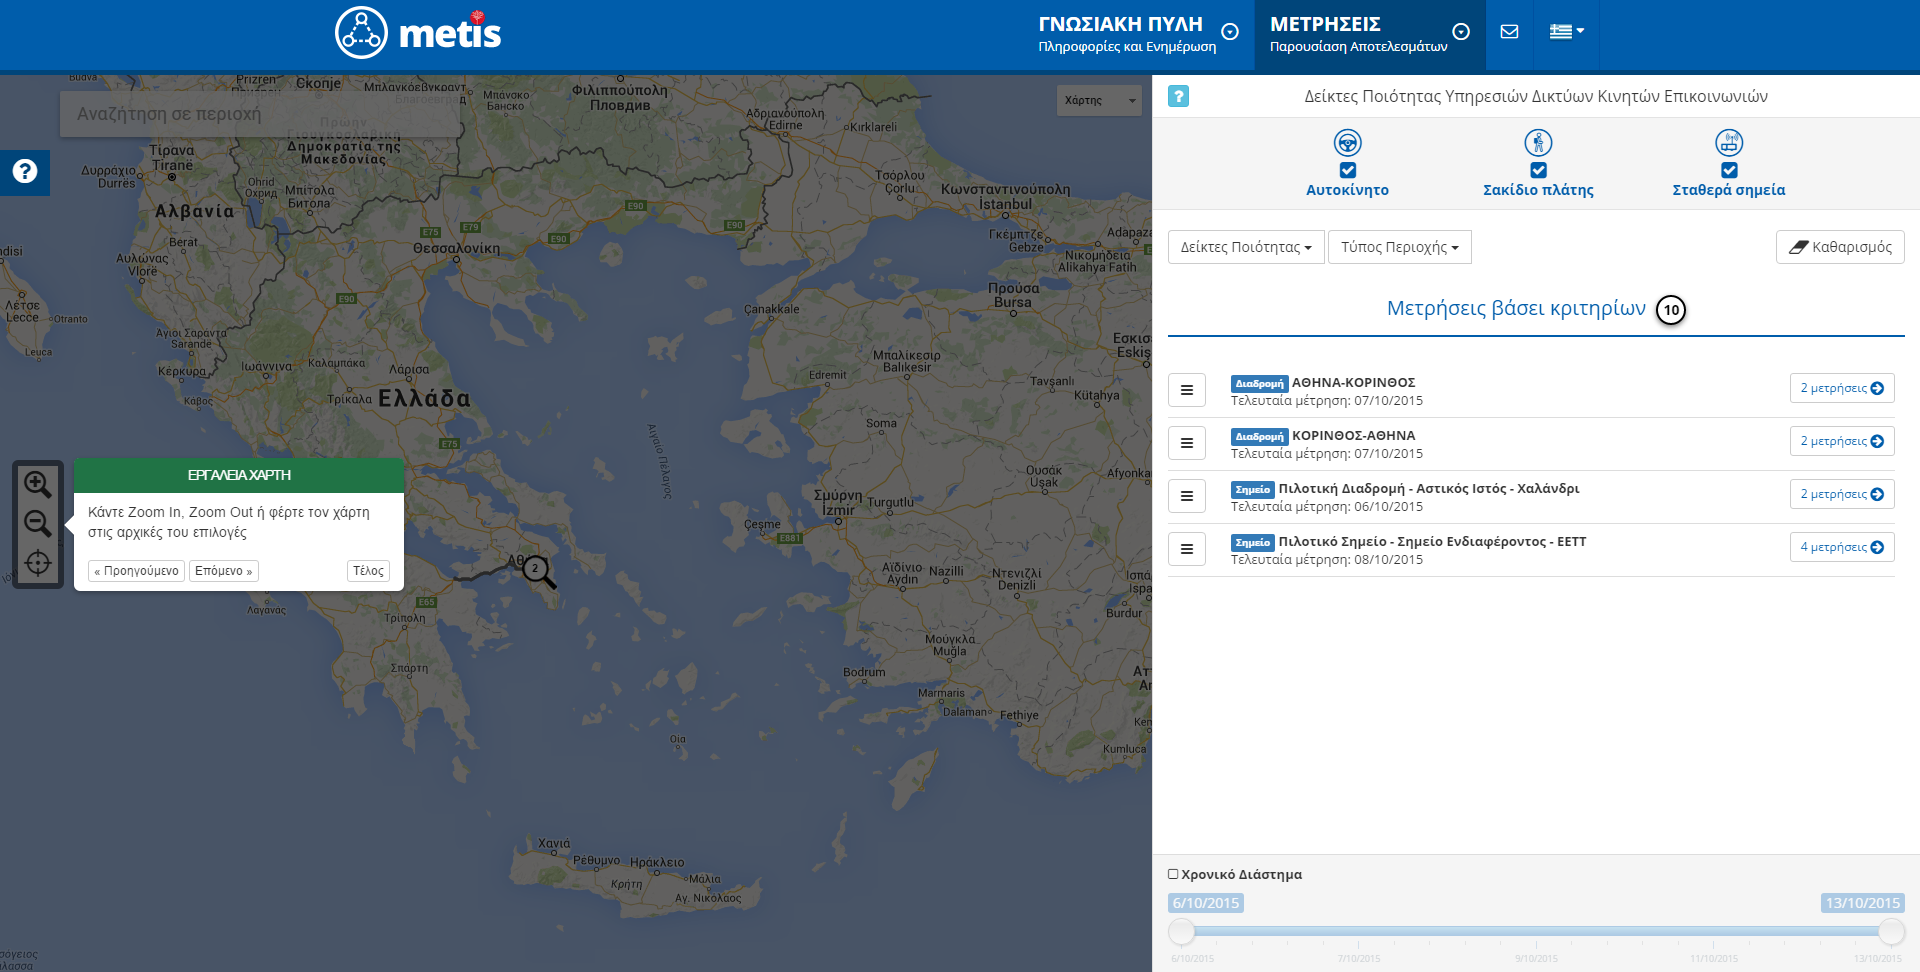
By using the tools of the map, they can find the measurement they are looking for.
Finally, they may look for a location on the map and find a specific measurement.
